Recent Posts of infographic

13 July, 2021
The COVID-19 pandemic has fundamentally changed the way people work and learn across industries, and developers are no exception to that. Although in the grand scheme of things, our data indicates that many developers have been weathering well the repercussions of an unprecedented crisis, there is much more to tell.

11 May, 2021
In our last infographic, JavaScript was the most popular programming language. What has changed in terms of the sizes in the last six months? You can find the answers in this infographic with key findings from our Developer Economics 20th edition survey, which ran between November 2020 and February 2021 and reached 19,000 developers worldwide.

15 July, 2020
What did developers do during Covid-19 outbreak? Who worked remotely, who did all the cooking, and who missed travelling? Our Covid-19 infographic sums up which lifestyle changes developers had to make.

17 June, 2020
In our 18th survey wave, we’ve asked developers whether they contribute to open-source software, and if so, why? In this post, we’ll explore who the contributors to open-source software are, their reasons for contributing, and finally what open-source support they expect from companies. Open-source contributors tend to be younger than non-contributors. More than a third […]
16 April, 2020
Which programming languages the developer nation uses the most? Our data reveal which programming language communities are rising faster than others, which are dropping down the rankings, and which are the new additions to the club! Take a look at our infographic containing key findings from our Developer Economics Q4 2019 survey. First of all, […]
10 April, 2018
We recently published brand new State of the Developer Nation report 14th edition, based on the insights from our Developer Economics survey which ran in Q4 2017 and reached over 21,700 developers in 169 countries. We reveal developers’ thoughts on which emerging tech will have the most impact in the next 5 years, the future of serverless platforms, the most promising AR/VR hardware, and the most popular programming languages that make it all possible.
20 September, 2017
We recently announced the State of the Developer Nation Q3 2017, our popular semi-annual report based on key insights from the largest, most global developer research program. The State of the Developer Nation Q3 2017 report is based on the 13th edition Developer Economics survey, which looked into the most trending development topics including tools, SDKs, training, distribution channels and development resources

02 February, 2017
The State of the Developer Nation Survey (H2 2016) was by far the largest in participation. The best way to illustrate this is by an infographic, highlighting important facts and figures.

13 December, 2016
Building strategies for user acquisition and retention are the two major tasks for dev teams after they have built an app, and analytics helps understand exactly what is happening and how to keep building traction. From there, new possibilities can emerge that will help you grow your user community even stronger and help you identify novel ideas that may offer you a winning edge.
05 July, 2016

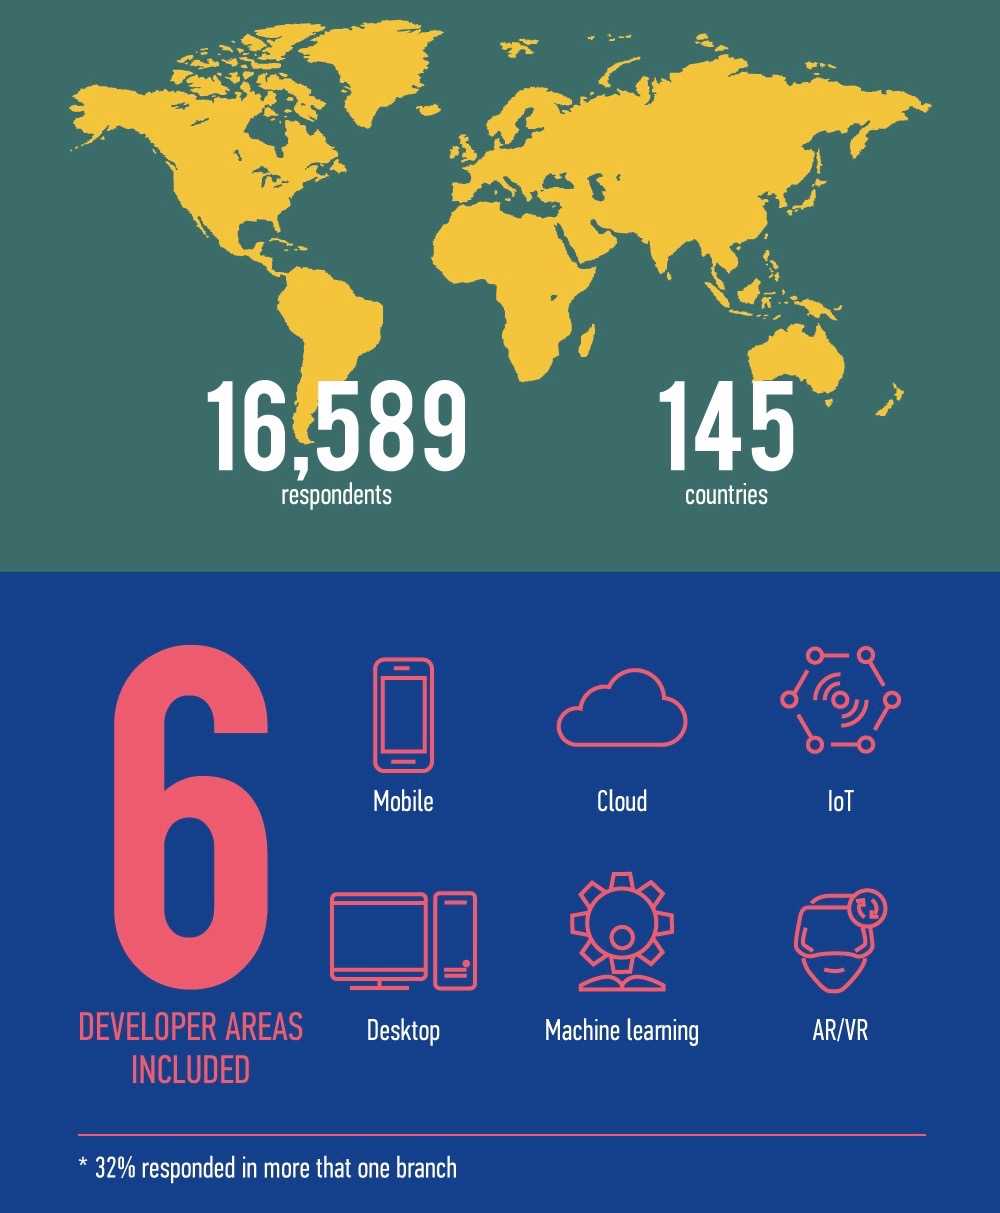
Have a look at this infographic about the Developer Economics: Developer Tools Benchmarking survey, check the numbers and you will be able to find out how it has come to be the most global developer survey.