Recent Posts of Mark Wilcox
20 September, 2017
We recently announced the State of the Developer Nation Q3 2017, our popular semi-annual report based on key insights from the largest, most global developer research program. The State of the Developer Nation Q3 2017 report is based on the 13th edition Developer Economics survey, which looked into the most trending development topics including tools, SDKs, training, distribution channels and development resources
31 July, 2017
Welcome to the full rundown of the Developer Economics survey Q3,2017 (April-June) prize-draw winners. Below you’ll find a table comprised of the winners. We’ve listed the name and countries of all the people that have won and given us permission to share their details . For those where we are awaiting permission, their emails are displayed (but obfuscated for security reasons) and finally those who’d prefer not to share their details, we’ve simply displayed their initials and country.

16 May, 2017
Google and Facebook are two of the world’s most powerful companies and each has created a framework for building web apps. Angular and React respectively appear to be in a battle for the future of the web, with the active online debate and adoption for large consumer-facing apps seeming to lean quite strongly in React’s favour at present. Are they collectively taking over the front-end? Is React really leading? Our data from a broad cross-section of nearly 6,000 web developers may surprise you.
11 April, 2017
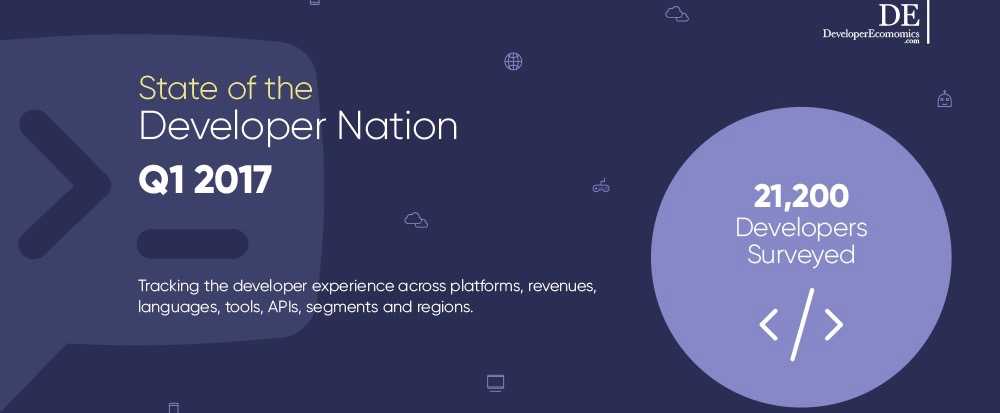
For the first time in the history of Developer Economics, VisionMobile asked developers how much they earn in salaries and contractor fees, to explore what projects and types of development are more lucrative around different locations. What’s more, the report uncovers how technology battles continue on the web front with Angular vs React Javascript, Amazon Web Services is in a price war with their public cloud competitors, the IoT market is underdeveloped and highly fragmented, and Machine Learning developers are striving to identify what is the ideal programming language to use.

02 February, 2017
Welcome to the full rundown of the State of the Developer Nation Survey (November-December 2016) prize-draw winners. Below you’ll find a table comprised of both the email addresses and countries of all the people that won (the emails are obfuscated for security reasons).

02 February, 2017
The State of the Developer Nation Survey (H2 2016) was by far the largest in participation. The best way to illustrate this is by an infographic, highlighting important facts and figures.

30 September, 2016
In this article I aim to help with the above challenge by means of a slightly unconventional approach: In my research I tried to quantify the merits of the most popular libraries, given a series of “developer-friendly” metrics.
Sounds weird and subjective? It is. Read on.

25 August, 2016
The world of mobile commerce is evolving fast, and is only going to become more important as it grows and changes so rapidly, but mobile network operators will struggle to be more than a big player in it.
05 July, 2016

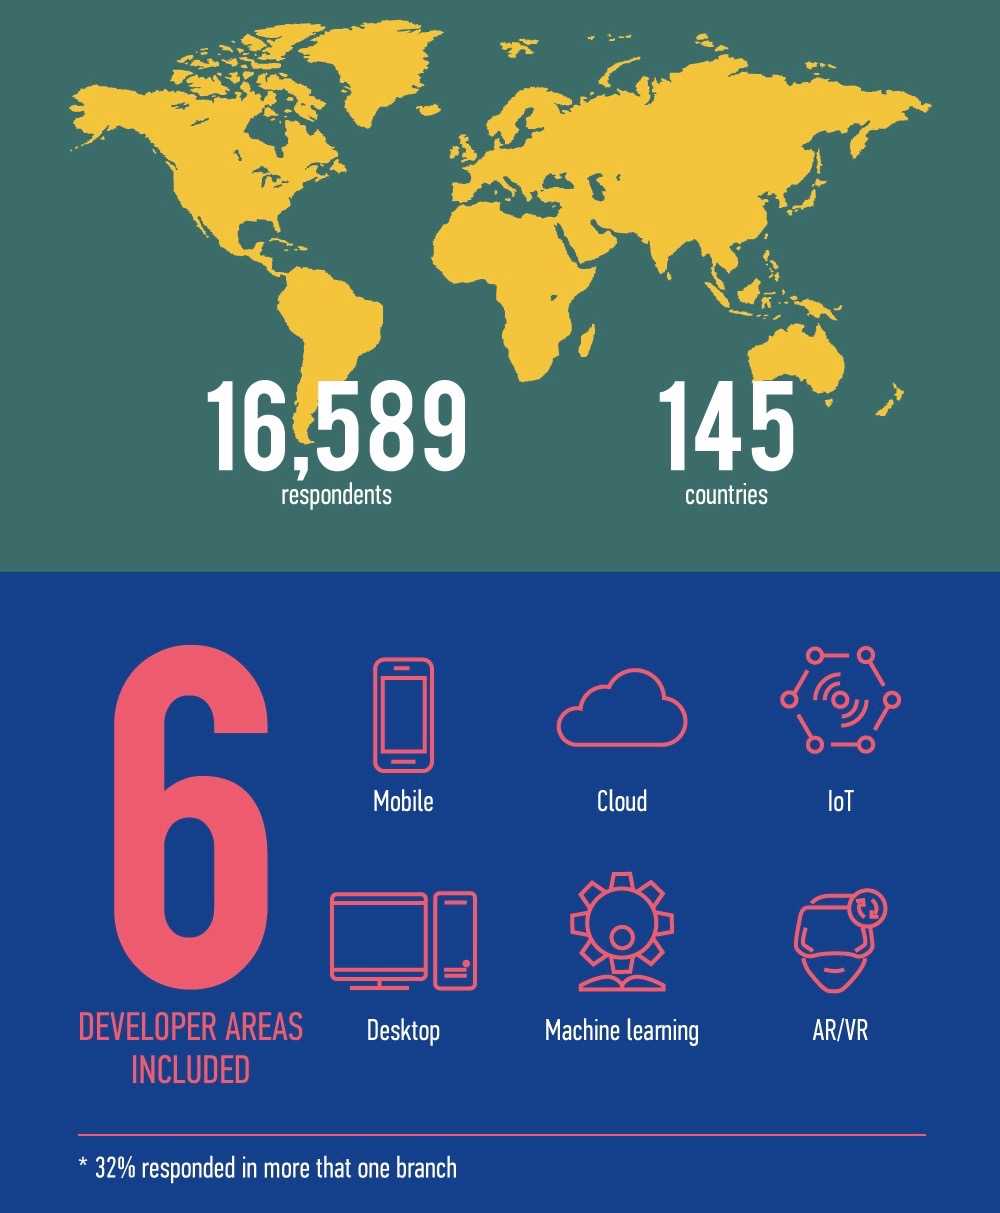
Have a look at this infographic about the Developer Economics: Developer Tools Benchmarking survey, check the numbers and you will be able to find out how it has come to be the most global developer survey.
29 June, 2016
Welcome to the full rundown of the Developer Economics: Developer Tools Benchmarking (April-May 2016) prize-draw winners. Below you’ll find a table comprised of both the email addresses and countries of all the people that won (the emails are obfuscated for security reasons).