August 31, 2012
Most app makers are not primarily in the game to make money. The primary reason for developer platform selection is not app monetisation, but reach; irrespective of platform, 54% of developers adopt a platform because of reach, while 43% cite low cost and 30% cite revenue potential. Moreover, out of the eight types of app developers we identified, only three segments (Explorers, Hunters and Guns for Hire) are directly motivated by money when committing resources to a new platform.
Among those of you that are in it for the bling, developer profitability is a hotly debated topic. Apple’s iOS is generally thought to support greater revenues per application, compared to Android, but the evidence is mostly anecdotal. Many stories of overnight successes circulate the internet, but it’s not clear if they are replicable.
[newsletter message=’Want more content like this? Subscribe now!’ button_text=’Jump In’]
To stay above the app poverty line you need to make a sensible budget plan for your app. This requires that you have realistic expectations about the costs and revenues that you can expect. Based on VisionMobile’s Developer Economics 2012 survey, we can now offer you an informed opinion.
Key insights and recommendations:
- The good news first. App developers have about a 50-50 chance to break even. In earlier research, we found that over 40% of developers achieved at least the revenue levels they were expecting.
- Runaway successes, however, are rare. Your chances at stellar revenues are well below 10%.
- Much more likely, you will end up below the app poverty line. One in three developers don’t earn enough from apps to make it a sole source of income.
- In our 2011 survey, there were almost 5 times more developers who are dissatisfied with their mobile application revenues than there are satisfied developers.
- We estimate the development costs for an iOS app at over $27,000 and for Android at over $22,000. The average revenue is between $1,200 and $3,900 per app per month, depending on the platform.
One in three developers below the app poverty line
Our Developer Economics 2012 survey analysed the average revenues per app generated by the 1,500+ developers who took part in our survey. A large percentage of developers (29%) was not sure about how much money they made. Some do not aim to make money. we’ll disregard those for the moment.
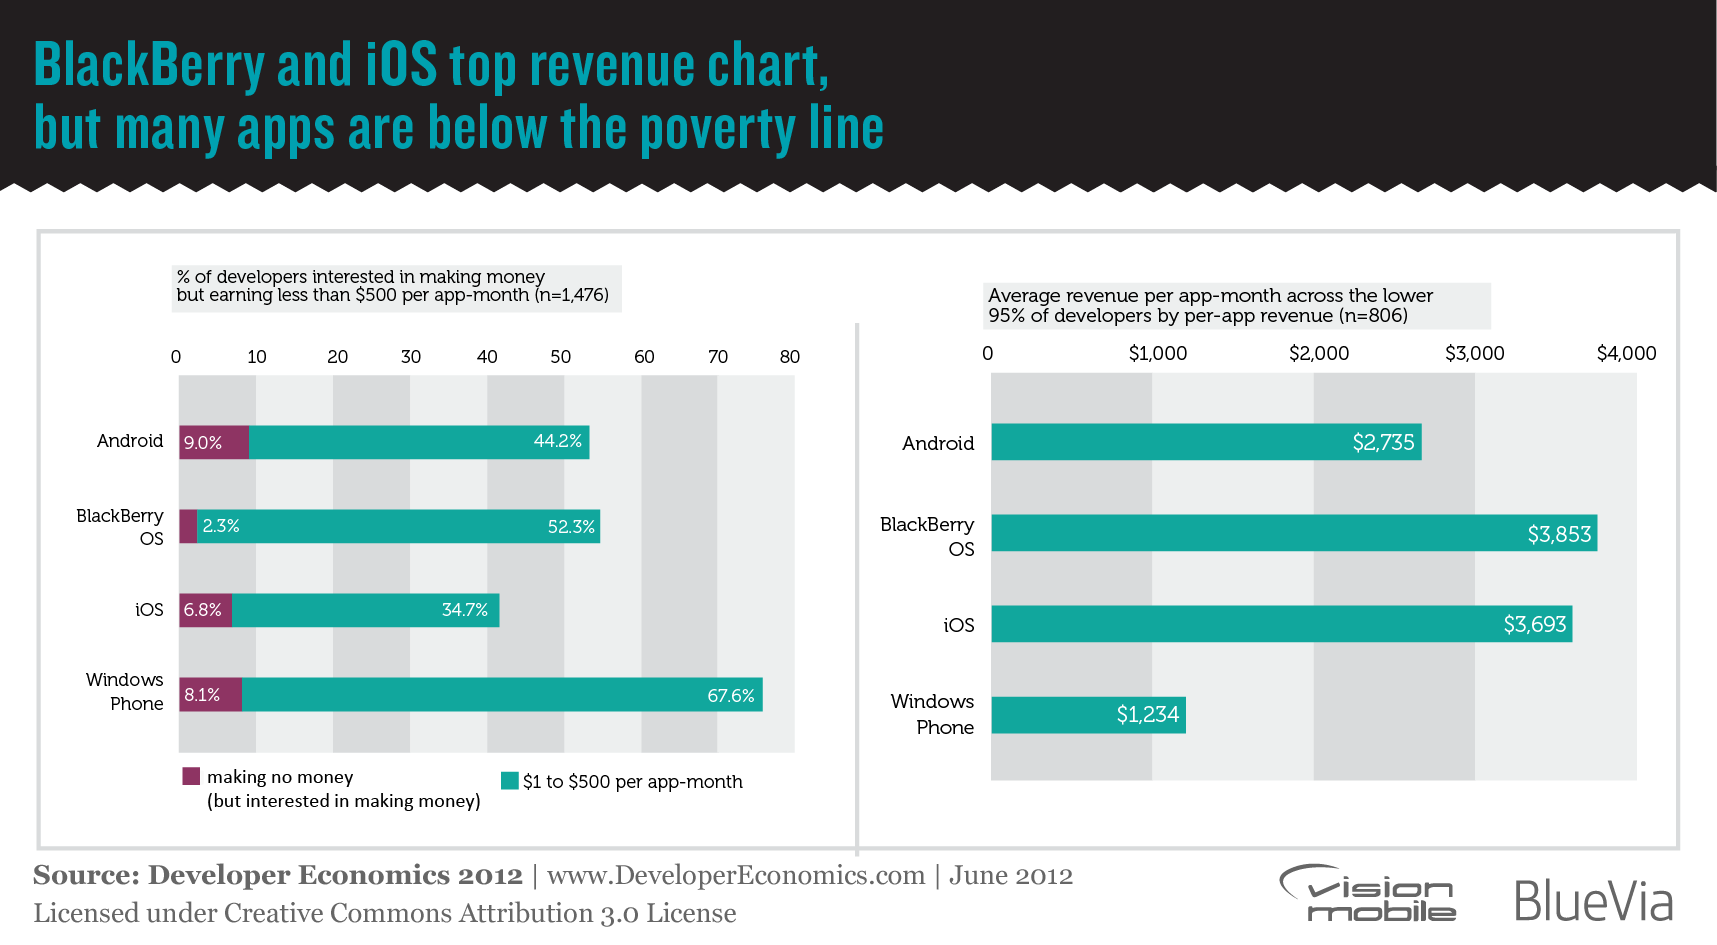
Among those that knew, we found that an app has a 35% chance of generating $1 – $500, and that one in three developers live below the “app poverty line”; That is, they cannot rely on apps as a sole source of income, even if developing multiple apps. Moreover, around 25% of all developers do not generate any revenue at all, although some do not aim to make money.
Average revenues of $1200-$3900 per app-month
Average per-app revenue is in the range of $1,200-$3,900 per month depending on platform. Per-app revenues are distributed across the range from 0 to well over $100,000 per app per month. Average dollar ranges across such a wide distribution of revenues doesn’t really speak to how much money developers can make on a given platform, though.
14% of developers will make somewhere between $500 and $1,000 per app, while 13% will generate between $1,001 and $5,000 per app per month. Less than 7% of all developers will make more than $10,000 per app per month, according to our survey.
The cost side of the equation
The details of cost structure are discussed in detail in other articles, so we’ll limit ourselves to the big picture here. Costs, like revenues, are distributed over a wide range, from $5,000 for a simple app to several hundreds of thousand dollars. For example, Twitterific estimated that their app cost in the neighbourhood of $250,000 dollars. It’s prudent to plan for cost overruns.
We found that the average app will take approximately three man-months to develop. Some 39% of developers across all platforms report that development time falls within one and three man-months, 34% report less than 3 months and 28% report more than 3 months.
iOS is the most costly platform to target, with an average cost of $27,000 per app, 21% more expensive than Android and 81% more expensive than Blackberry. Blackberry has the lowest development costs among the four platforms. The low cost platforms include Windows Phone and mobile web, with an average development cost that is 17% higher than Blackberry, and Java ME, which, at +1% is on par with Blackberry.
The devil is in the details of course – and app development costs depend not only on the platform, but the app category. We found that communication and social networking apps (e.g., Foursquare, WhatsApp) require 14% more development time than maps and navigation apps (e.g., TomTom), and 52% more than news and media apps (e.g., Economist). Also, despite iOS generally requiring more development time, it is quite a bit faster to develop communication and social networking apps on iOS than on Android or Java ME.
Naturally, app development costs also depend on the cost of labour in each country. “In Colombia, it’s hard to charge more than $8,000 (USD) for a commissioned app. This is for an application that takes four weeks to develop,” notes Ivan Sosa, Head of Technology at Mobile Brand Experience. “If we were in North America, we could probably be able to charge 4-5 times that”.
“We get a lot of clients that have an unrealistic expectation of the amount of effort it takes to build a really good looking mobile app, so the biggest challenge is the education of our clients and the product managers working on the mobile app as to realistically how much work it is to build the app and what they need to expect in the process of building it,” explains Jeff Bacon, Director of Mobile Strategy at bitHeads, a Canadian software house with clients like the New York Times and ESPN.
Breaking even in app monetisation
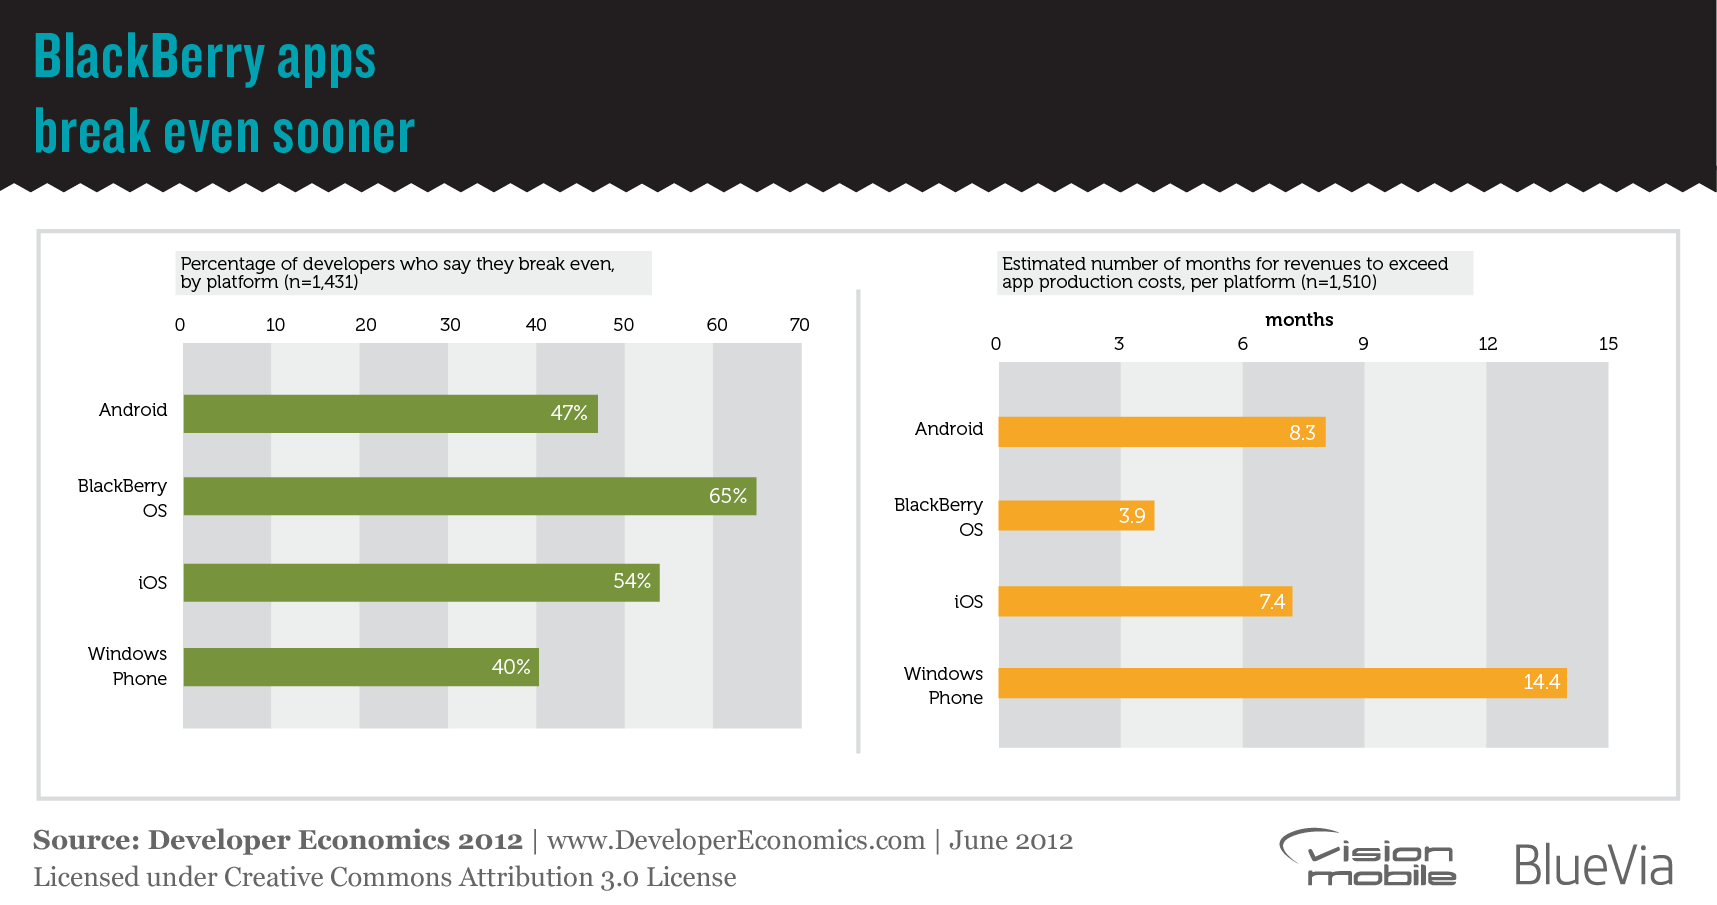
A frequently quoted data point suggests that startups have a 90% failure rate, i.e., only 10% manage to survive. We wanted to compare this figure with the failure rate in mobile app development, considering that many developers are also startups. What we found is that developers are in a much better position than most startups: at least 48% of all developers manage to break even.
These figures vary between platforms, in some cases significantly. Overall, Blackberry OS has more developers that break even, compared to all other platforms: 65% of Blackberry developers indicate that they break even within two years. Meanwhile, 54% of iOS developers break even, followed by Android at 47% of developers. Mobile web has the least number of developers breaking even overall, with 33%. We also found that if you’re a mobile web developer, you should break even within the first year; otherwise, the chances get very slim.
Satisfaction
So, at the end of the day, are developers satisfied with their earnings? We don’t have recent data on this, but we can draw some conclusions from our earlier 2010 and 2011 research.
The good news? In the Developer Economics 2011 survey, 44% of respondents reported that their revenue was at least as expected. The bad news? There were almost 5 times more developers who are dissatisfied with their mobile application revenues than there are satisfied developers. For a third of developers, revenues were less than expected (26%) or totally unsatisfactory (9%).
This is a similar picture than the results of our 2010 survey, a year earlier. At that time, 5% of developers indicated that revenues were very good (more than expected), while 24% of developers reported poor revenues.
Recent Posts

August 27, 2025
How to Find the Right Learning Path When You’re Switching to a Tech Career
See post

August 27, 2025
The Hidden Challenges in Software Development Projects: Key Insights from Our Latest Survey
See post

August 22, 2025
Developer News This Week: AI Speed Trap, GitHub Copilot Agents, iOS 26 Beta Updates & More (Aug 22, 2025)
See post


