February 13, 2013
Usage analytics tools usually have a very simple integration which enables developer to get basic information about their active user base – size, usage frequency, device models, OS versions and app versions in use. More custom integration enables developers to log events to the usage analytics platforms when users perform specific actions within the app. This allows developers to track which features or functions are most use, measure conversion rates and pinpoint where in UI flows users are giving up if actions are not being completed.
User analytics services gain in importance as competition intensifies
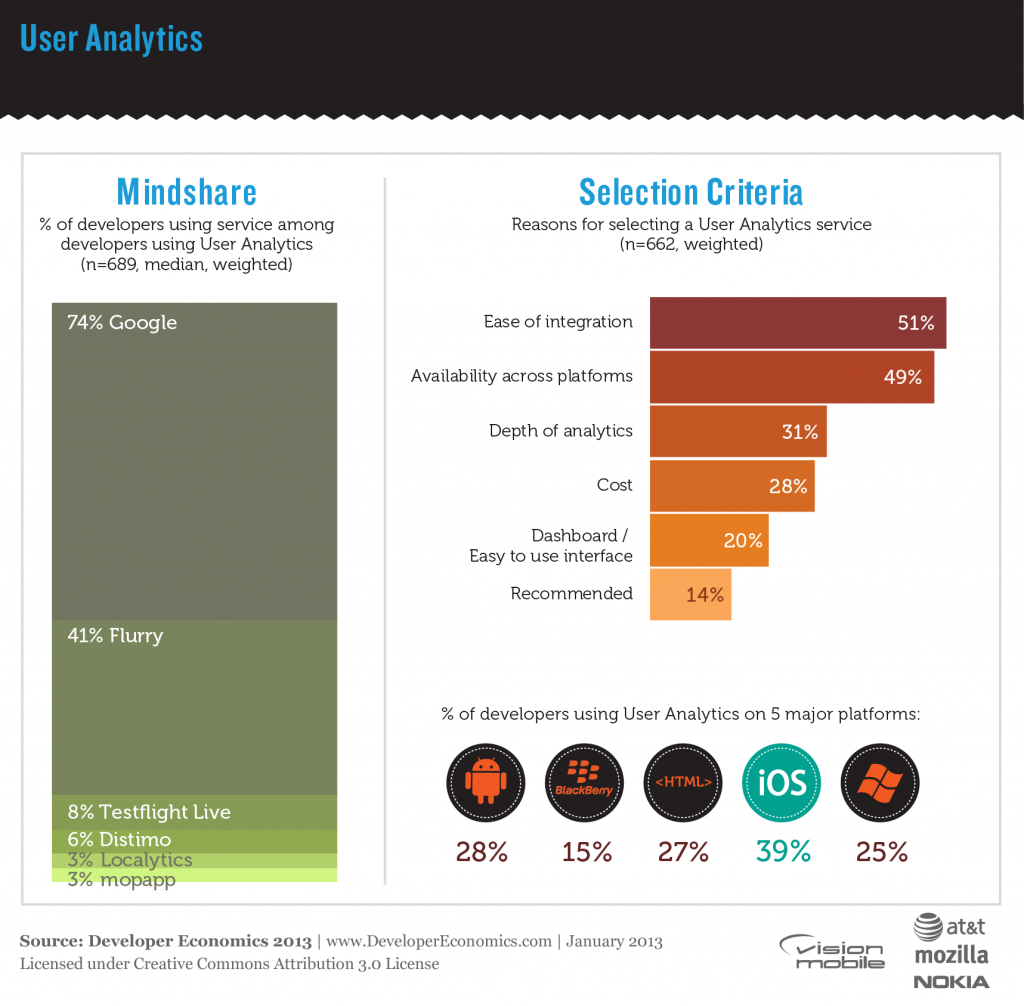
User analytics services are becoming increasingly important as competition in app development continues to rise. The ability to track how users interact with apps is extremely valuable for both developers and product managers and to some extent acts as a proxy for user feedback. The absence of a direct two-way communication channel between developers and users means that user analytics often provide the only channel from user to developer. 28% of developers use user analytics services overall, but usage rises with the number of apps developed, reaching 39% among developers working on more than 10 apps per year.
Analytics services seem to be significantly more important among iOS developers (used by 39% of iOS developers) compared to other platforms. This suggests that iOS developers take more interest overall in their user base, a fact that could indicate a more professional approach to development. Among the top platforms, user analytics tools are the least popular with BlackBerry developers (15%). BlackBerry has suffered high churn of its affluent user base and developers sticking with the platform are likely to be working on outsourced ports with little interest about the way that users interact with an app. Among the other major platforms around a quarter of developers use user analytics, with Android being slightly ahead (28% of Android developers).
Google and Flurry lead the pack
The picture in user analytics services is quite telling with two services dominating: Google and Flurry. Google has traditionally been strong in web analytics but it has now extended its stronghold on to mobile platforms commanding a 69% mindshare among developers employing User Analytics services. However, its dominance is mainly observed among HTML developers and although it leads on Android, BlackBerry and Windows Phone, its lead is by a small margin. Runner-up Flurry, is used by 49% of developers employing User Analytics services but is the leading User Analytics service on iOS (64% vs. 58% for Google). Flurry, being one of the pioneers in User Analytics has grown into one of the heavyweights in app ecosystems, and is recognised as a de-facto analytics platform for developers. Beyond these two services, there are numerous smaller players vying for third place, currently held by Testflight Live, a service recently acquired by ad mediation service Burstly in a move that is quite typical of the synergies between different tools and services that drive consolidation in the marketplace.
User Analytics services are stronger in Media apps (News/sports/weather/magazines) as well as in Entertainment apps, used by 36% of developers working on such apps. However, they are more or less popular across all app categories, but less so in Education/Reference apps. Google analytics is stronger overall across all these categories, with the exception of Games where both Google and Flurry are equally strong.
Minimizing overhead is the priority
Developers opt for services that are easy to integrate within their apps or that are available across several platforms as indicated by 51% and 49% of developers using user analytics services. I.e. the main priority for developers is to minimise the overheads associated with using user analytics, while optimising analytics comes third: only 31% of developers using user analytics services are concerned with the depth of analytics, and only 13% are interested in real-time reports. Cost is a also deciding factor as pointed out by 28% of developers employing user analytics.
We asked developers using User Analytics services to indicate the number of active users of their most popular app. Excluding those apps that have more than 500,000 users, developers’ most popular apps have an average active user base of 56,000 users, although this number varies widely within platforms and across platforms. iOS developers indicated 70,000 users vs. 51,000 users on average for Android. The median user base, is 27,500 users for iOS and 15,500 for Android, indicating that while Android commands a higher market share, iOS users engage more actively with the platform when it comes to apps with less than 500,000 active users.
[doritos_report location=’DE13 Article – User analytics’]
Which user analytics tools are other developers using?
[toggle title=”Important things to know about this interactive graph”]
- All the filters in the graph refer to survey questions in which respondents could select multiple answers. This means that there is no direct link between the filter and the use of the tool. For example, filtering on “Android” means that the respondents develop Android apps. It doesn’t imply that they use the tools for their Android apps specifically, or even that the tool supports the Android platform. Use filters as a guideline only.
- Keep an eye on the sample size. If the sample size is low, the graph doesn’t offer strong conclusions about the popularity of different tools. Use your good judgment when making decisions.[/toggle]
Find the best analytics tool for you!
[sectors ids=’40’]
Recent Posts

August 27, 2025
How to Find the Right Learning Path When You’re Switching to a Tech Career
See post

August 27, 2025
The Hidden Challenges in Software Development Projects: Key Insights from Our Latest Survey
See post

August 22, 2025
Developer News This Week: AI Speed Trap, GitHub Copilot Agents, iOS 26 Beta Updates & More (Aug 22, 2025)
See post
