July 11, 2024
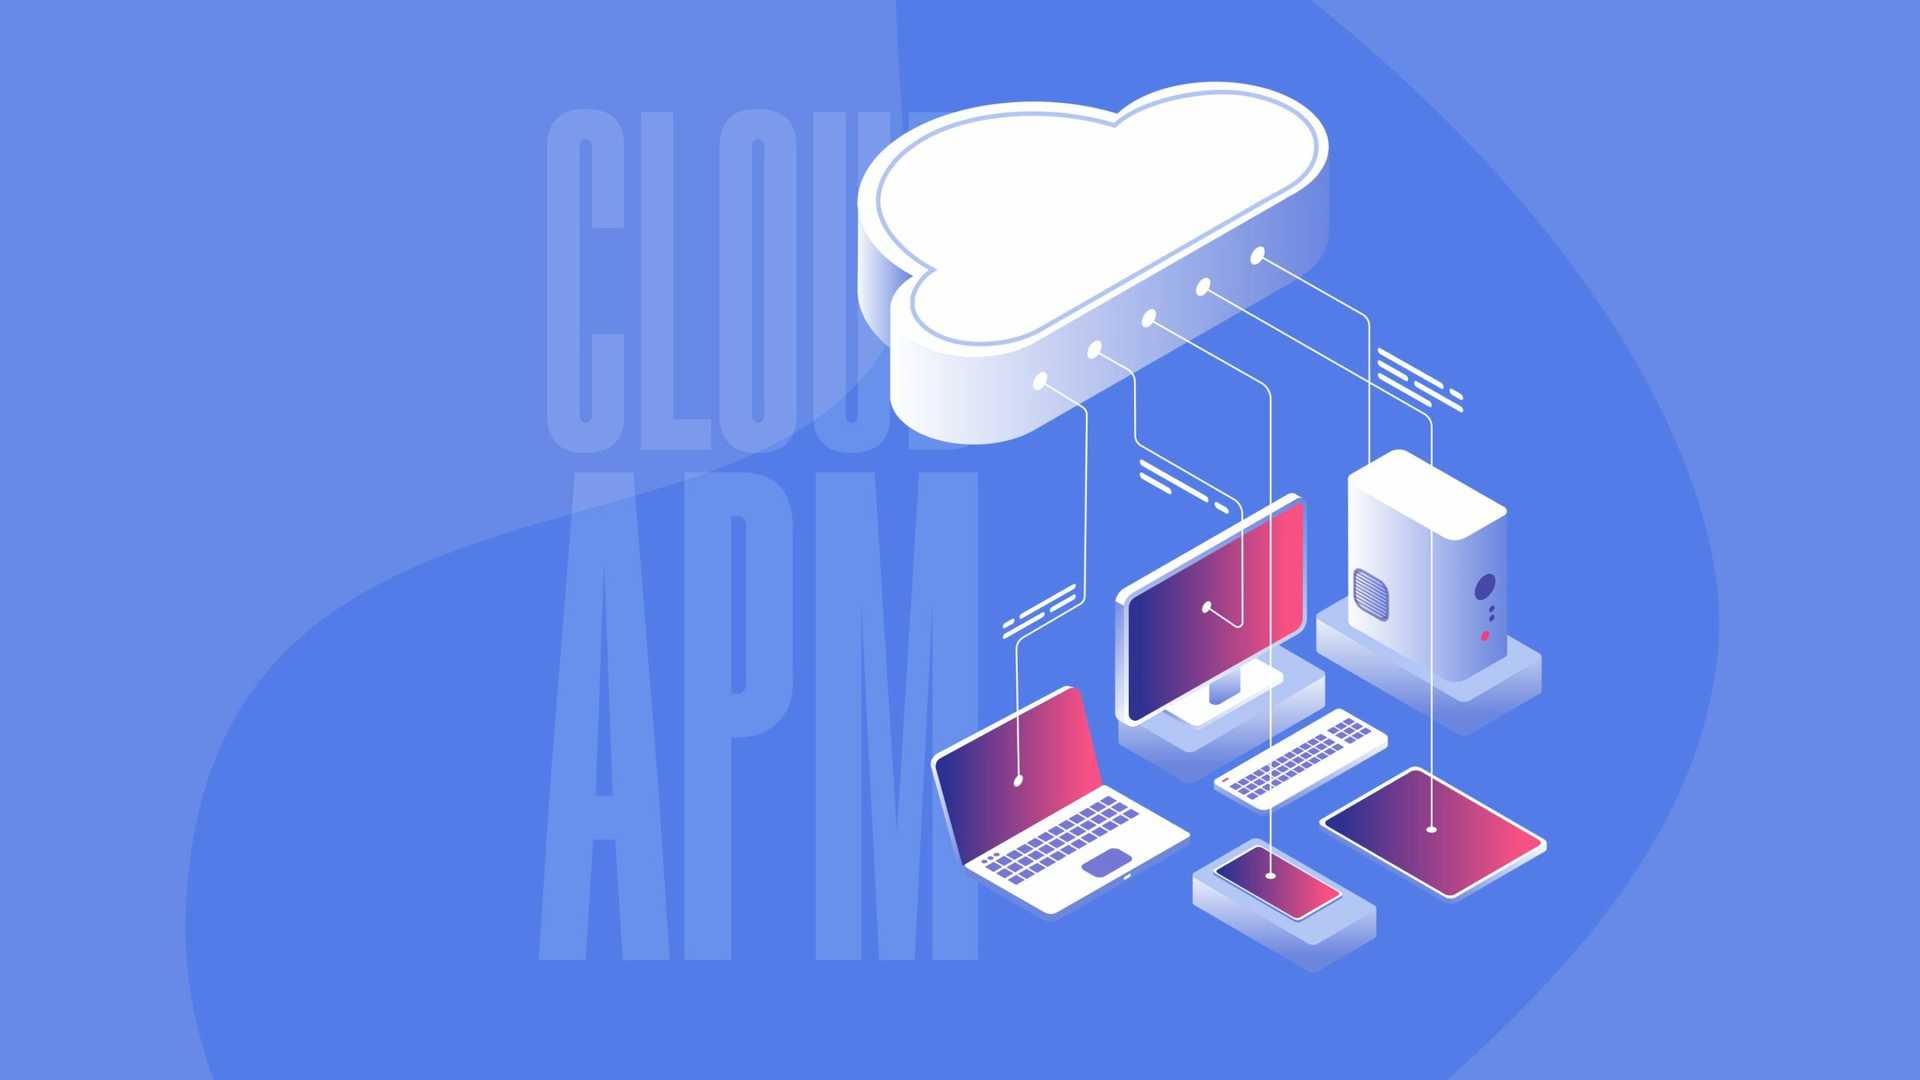
The performance of cloud applications plays a big role in user experience. At the end of the day, we’re all looking for a smooth-running service that’s free from bugs and crashes. A slow-running app is a one-way street to frustrated users, but you can avoid this eventuality with Cloud Application Performance Monitoring (CAPM).
CAPM is the process by which you track and manage the performance of cloud applications. It involves monitoring the key metrics that determine performance and taking measures to optimise where necessary. Overall, the goal is to achieve the best possible experience for all of your users.
What is CAPM?
Cloud application performance management is achieved by monitoring important performance metrics so that any issues looming on the horizon are caught early. It helps you to maintain the best user experience possible and should be a key part of your customer orientation strategy.
Core Components of CAPM
Let’s take a look at the essential elements of CAPM:
- Real-time monitoring: Application performance is continuously tracked to pick up issues instantly, meaning no problem goes undetected. For instance, a live chat app relies heavily on real-time monitoring to ensure smooth and uninterrupted user interactions, making it crucial to address any performance issues immediately.
- Alerts and notifications: You can set up alerts to notify you when performance metrics drop out from the acceptable range, so you’re always kept in the loop.
- Root cause analysis: Knowing there is a problem is only half the story. Root cause analysis will also tell you what the underlying problem is.
- Performance optimisation: This is where you swing into action to make the changes needed to get your cloud application performance back on track.

CAPM vs. Traditional APM
If you’re familiar with application performance monitoring, you might be wondering if CAPM is really so different. However, they are distinct in a few ways.
Environment Focus
Traditional APM typically applies to on-premises applications and, as the name suggests, CAPM focuses on cloud-based applications. What’s important about this differentiation is that on-premises applications need to be monitored within a static, controlled environment, whereas cloud applications require a dynamic environment that can change based on usage and demand.
Scalability
Cloud environments are scalable by nature, and CAPM is able to handle this. As user demand rises or drops, CAPM can likewise scale resources up and down, achieving optimal performance with minimum manual intervention. Meanwhile, traditional APM usually deals with fixed resources that need manual adjustments.
Integration
The transition from mainframe to cloud applications is an important consideration. CAPM integrates with cloud services and platforms to allow for comprehensive monitoring across different components within the cloud ecosystem. This provides a complete view of the performance of the application, whereas traditional APM tools are unlikely to offer the same level of integration with cloud-specific services, and are therefore less effective.
Moreover, as CAPM integrates deeply with cloud services and platforms, it also expands the attack surface — the set of points where unauthorized access can occur. Therefore, it is crucial to ensure that security measures are part of the performance monitoring process to protect against vulnerabilities that could be exploited through these additional points of exposure.
Resource Allocation
APM’s primary focus is on the application itself, and this rarely widens to the infrastructure around it. CAPM, on the other hand, not only monitors the application’s performance but keeps an eye on the underlying infrastructure and resources. Memory, CPU, and storage are all tracked to assess if they are being used efficiently.

Key Metrics in CAPM
The effectiveness of CAPM lies in closely monitoring the right metrics.
Response Time
How long is a user waiting for an application to respond to a request? Faster response times keep everything ticking over quickly and, most importantly, keep users happy. High response times point to performance bottlenecks, suggesting improvement might need to be made in database indexing strategies or in optimising server configurations to speed up retrieval times.
Error Rates
Keeping on top of the frequency of errors happening within the application will tell you where there are common problems that are damaging the user experience. If errors are happening a lot users are likely to get frustrated quickly, and you may lose their trust. As such, lowering error rates should be a top priority.
Request Rates
How is the application managing traffic? This metric will tell you the volume of user requests currently being handled, which makes sure the application scales as needed. As high request rates can put a strain on resources, causing slowdowns or even crashes, they need to be monitored to keep performance steady during peak times.
Application Availability
Measuring the accessibility of an application and the extent to which it’s operational shows you how consistent your service is. High availability is a must to make sure users know they can rely on the application to be there when they need it, whereas excessive downtime can damage that trust.

Strategies for Effective Cloud Application Performance Monitoring
Use these tactics for CAPM to work at maximum effectiveness.
Ensure Compatibility with Existing IT Infrastructure
Effective software development practices are crucial for integrating CAPM tools with existing IT infrastructure, ensuring that all systems operate cohesively and are aligned with business objectives.
Before you go live, conduct some tests to make sure everything is working well together and the data you’re capturing is accurate. If you have a team, provide them with adequate training.
Managing Real-Time Monitoring and Alerts
When you are informed in real-time of high error rates or slow response times, you can fix issues before they snowball and cause big problems for users. Configure alerts for specific performance thresholds, so you or your team members get immediate notification if anything doesn’t look right.
For example, if the average response time of an application is usually 200 milliseconds, a consistent response time of 500 milliseconds for more than five minutes would send an alert. Every alert should be integral to performance and actionable, so when one comes through, you know it’s important.
Additionally, your thresholds should be precisely defined based on historical data to balance sensitivity and relevance. There should also be clear incident management protocols that kick in, in response to an alert, with assigned roles and documented procedures. Maintain DevOps best practices by regularly reviewing and adjusting thresholds to maintain the highest performance standards for your cloud application.
If you use a WordPress site for your business, incorporating a WordPress table plugin can help you effectively organize and display performance data in a clear and accessible manner.
Root Cause Analysis
Finding out the underlying cause of cloud application performance issues requires effective Root Cause Analysis (RCA). This way, you both fix the problem and stop it from happening again. One of the best techniques for identifying the root cause of an issue is log analysis, where you examine the logs to find errors and anomalies.
Another effective technique is transaction tracing, which tracks the journey of a transaction through an application to discover where bottlenecks are occurring. Performance profiling is also useful, monitoring resource usage and revealing where the most resources are being consumed.
CAPM tools have advanced features on their dashboards that provide real-time and historical data, so you can detect what may be a recurring theme or a one-off anomaly. With error tracking, you can capture in-depth information about errors, such as stack traces and user actions, which are integral for root cause diagnosis.
Tools should also offer synthetic monitoring, which simulates user interactions to test performance issues without affecting real users.

Optimise Application Responsiveness
You’re looking to optimise application responsiveness wherever possible to reduce latency, provide quicker user interactions, and prevent negative repercussions for users. Suppose, for example, high latency was occurring in a cloud-based CRM platform. This could slow down valuable tasks like sales discovery calls, leading to irritated users and missed opportunities.
Combat slow load times by using content delivery networks (CDNs), employing efficient caching strategies, and optimising database queries. Improved performance will give users confidence that the application will always allow them to complete tasks without delay.
Ensure Application Availability
Maintain high availability and reduce downtime by establishing redundancy and failover mechanisms. Redundancy involves duplicating all the critical components and systems so that if one fails, another can take over without disrupting service. For instance, cloud-based call centre software might use redundant servers to ensure continuous operation, even during hardware failures.
Failover mechanisms play a similar role, automatically redirecting traffic to backup systems when the primary system is unavailable. This is invaluable for applications that have a big impact on sales or customer service, where downtime can be seriously costly.
There is also a benefit to adopting cloud-native practices like auto-scaling and load balancing. Auto-scaling adjusts resources in real-time based on demand and prevents the overloading of servers, while load balancing spreads the traffic evenly across servers, improving application availability.
Remember, all these mechanisms should be tested regularly to make sure they are ready when a real problem arises.

The Future of Cloud Application Performance Monitoring
CAPM will continue to be an area that improves as technology evolves. The impact of generative AI has already made itself known, as AI and machine learning fuel predictive analytics in CAPM. This technology supports proactive performance management, discovering problems before they start to affect users. Edge computing allows for data to be processed close to the source, reducing latency and improving responsiveness.
Transform User Experience with CAPM
Providing the best possible user experience for your cloud-based applications is a top priority for any developer, and cloud-based performance monitoring is, without a doubt, one of the best ways to make it a reality.
CAPM gives you the heads up as soon as anything deviates from acceptable standards, so you can take action immediately. The visibility it gives you means no delays or bugs will go unnoticed and you can both fix issues promptly and understand how to stop them happening again.
Altogether, it’s the ideal approach to keep your application working perfectly and your users satisfied and happy.

Austin Guanzon – Tier 1 Support Manager
Austin Guanzon is the Tier 1 Support Manager for Dialpad, the leading AI-powered customer intelligence platform. He is a customer retention and technical support expert, with experience at some of the largest tech service companies in the US.You can find him on LinkedIn.
Recent Posts

August 27, 2025
How to Find the Right Learning Path When You’re Switching to a Tech Career
See post

August 27, 2025
The Hidden Challenges in Software Development Projects: Key Insights from Our Latest Survey
See post

August 22, 2025
Developer News This Week: AI Speed Trap, GitHub Copilot Agents, iOS 26 Beta Updates & More (Aug 22, 2025)
See post