September 22, 2015
We spend a lot of time on our mobile phones (that’s no surprise). But, what’s changing yearly about the way we use these devices? Simon Khalaf, Flurry’s CEO, wrote an interesting post that breaks down the above question and much more:
Last year, on the eve of the sixth anniversary of the mobile revolution, Flurry issued our annual report on the mobile industry. In that report, we analyzed time spent on a mobile device by the average American consumer. We ran the same analysis in Q2 of this year and found interesting trends we are sharing in this report.
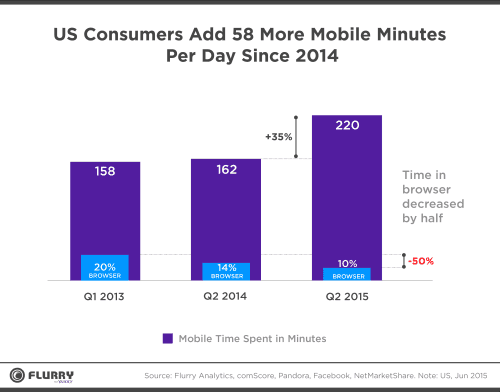
After putting the desktop web in the rear view mirror in Q2 2011, and eclipsing television in Q4 2014, mobile and its apps have cemented their position as the top media channel and grabbed more time spent from the average American consumer. In Q2 of 2015, American consumers spent, on average, 3 hrs and 40 minutes per day on their mobile devices. That is a 35% increase in time spent from one year ago and a 24% increase from Q4 2014. In just six short months, the average time American consumers spend on their phones each day increased by 43 minutes.

To put things in perspective, there are 175 million Americans with at least one mobile device. This means that, in aggregate, since November 2014, the US connected population is spending an extra 125 million hours per day on mobile devices. This growth rate is especially astonishing after seven consecutive growth years.
The Browser: Sidelined
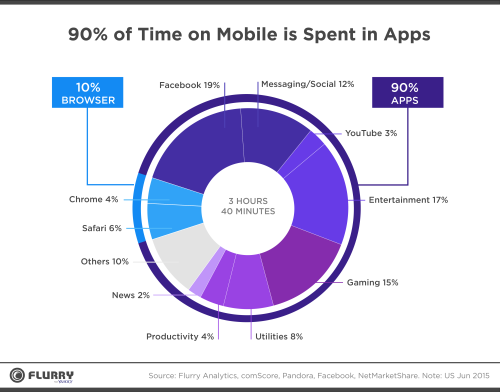
Looking at the chart above, today only 10% of the time spent on mobile is spent in the browser, down from 14% a year ago. The rest of the time, 90%, is spent in apps. Effectively, the browser has been sidelined on mobile. This has major implications on the digital industry in general and the content and media industry in particular. Historically, the media industry has relied almost entirely on search for user and traffic acquisition, building entire teams around SEO and SEM on the desktop web. But search engines are predominantly accessed from a browser. If mobile users aren’t using browsers, the media industry will have to look for new approaches to content discovery and traffic acquisition.
The Media Industry: Absorbed by Apps
The chart below takes a closer look at app categories. Social, Messaging and Entertainment apps (including YouTube), account for 51% of time spent on mobile.

Entertainment (including YouTube) grew from 8% of time spent last year, or 13 minutes per day, to 20% of time spent, or 44 minutes per day this year. This is 240% growth year-over-year, or an extra 31 minutes. That is more than the time it would take to watch an additional TV sitcom for every US consumer, every day!

Messaging and Social apps grew from 28% of time spent last year or 45 minutes per day to 31% of time spent or slightly more than 68 minutes per day this year. This is a 50% year-over-year increase. However, the majority of time spent inside messaging and social apps is actually spent consuming media, such as videos on Tumblr and Facebook or stories on Snapchat. A study by Millward Brown Digital showed that 70% of social app users are actually consuming media. While we can’t correlate the 70% directly to time spent, we firmly believe that media consumption, either articles read in the web view in app, or video consumed in the feeds, constitute the majority of time spent in social apps. This is a big trend and one that will be watched very carefully by traditional media companies. These companies have to adjust to a new world where consumers act as individual distribution channels. The growth in entertainment on mobile proves once again that content is in fact king and is beating the gaming industry in its own game.
The Gaming Industry: Time is Money
The completely unexpected result of our analysis this year is the dramatic decline in time spent for mobile gaming. Gaming saw its share decline from 32% last year (52 minutes per day) to 15% of time spent (33 minutes per day) this year. This is a 37% decline year-over-year. We believe there are three factors contributing to the decline.
- Lack of new hits: Gaming is a hit driven industry and there hasn’t been a major new hit the past 6 to nine months. The major titles like Supercell’s Clash of Clans, King’s Candy Crush, and Machine Zone’s Game of War continue to dominate the top grossing charts and haven’t made room for a major new entrant.
- Users become the game: Millennials are shifting from playing games to watching others play games, creating a new category of entertainment called eSports. This summer, Fortune named eSports, the new Saturday morning cartoons for millennials. In fact, some of the most watched content on Tumblr is Minecraft videos created and curated by the passionate Minecraft community.
- Pay instead of play: Gamers are buying their way into games versus grinding their way through them. Gamers are spending more money than time to effectively beat games or secure better standings rather than working their way to the top. This explains the decline in time spent and the major rise in in-app purchases, as Apple saw a record $1.7B in AppStore sales in July.
What the mobile industry in general and the app industry in particular have achieved in the past seven years is amazing. Flurry now measures more than two billion devices each month and sees more than 10 billion sessions per day. That is 1.42 sessions for every human being on this planet, every day. And that is just Flurry! If there is anything to say about the mobile and app industry it is this: Mobile is on fire and it is showing no signs of stopping.
Recent Posts

August 27, 2025
How to Find the Right Learning Path When You’re Switching to a Tech Career
See post

August 27, 2025
The Hidden Challenges in Software Development Projects: Key Insights from Our Latest Survey
See post

August 22, 2025
Developer News This Week: AI Speed Trap, GitHub Copilot Agents, iOS 26 Beta Updates & More (Aug 22, 2025)
See post